Reading DYLOS Data via Wireless RS232
This page consolidates the archived b-io.info tutorial on getting DYLOS DC1100 data out of a DB9 RS232 interface and into a more flexible logging pipeline.
Goal
The original tutorial solves a specific problem: DYLOS particle counters expose data over a DB9/RS232 interface, but the author wanted something cheaper and more flexible than keeping a Windows PC attached all the time. The result was a staged path:
- build an RS232 to USB cable
- read data directly on a computer or Raspberry Pi
- attach RS232 to an ESP8266
- publish over MQTT
- store/query the stream in SQLite and display it on the web
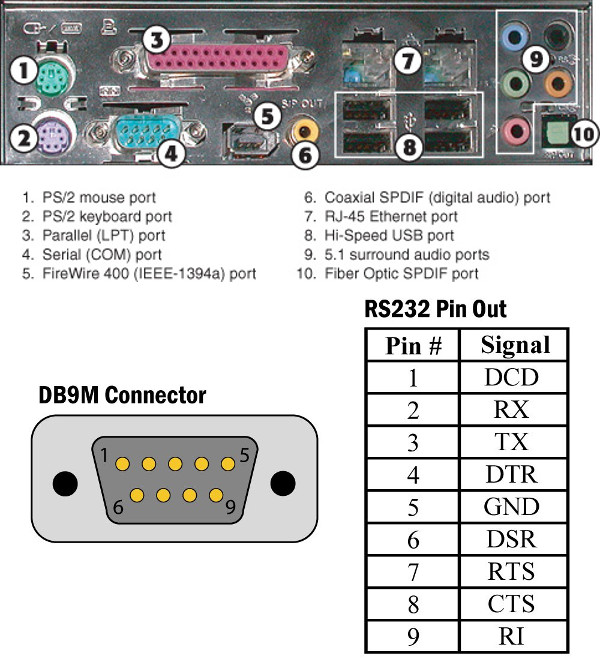
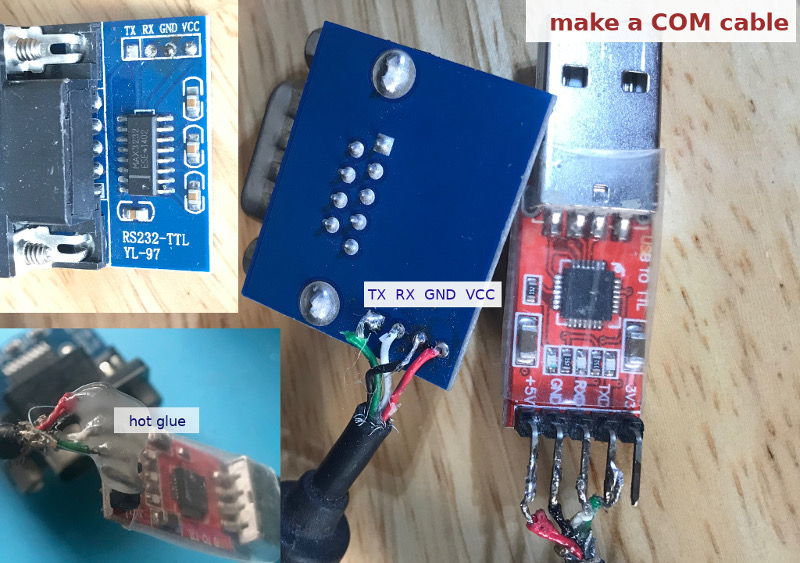
Step 1: Build a COM cable
The archived guide uses:
- a MAX3232-style RS232-TTL level shifter
- a CP2102 USB-TTL interface
- a DB9 connector or donor cable
The design goal is simple: let the MAX3232 handle voltage-level translation from RS232, then let the USB-TTL adapter present the signal to a normal computer.
Step 2: Log directly from a Linux machine
Once the serial link works, the simplest path is to read the DYLOS output directly on a Raspberry Pi or any Linux host and append readings to a text file.
Original repository:
The archived guide points to a Python script for the Raspberry Pi flow:
# full code:
# https://github.com/binh-bk/rs232-dylos/blob/master/dylos_rpi.py
That approach is low-risk and good for debugging because it avoids wireless transport until the serial parsing is proven.
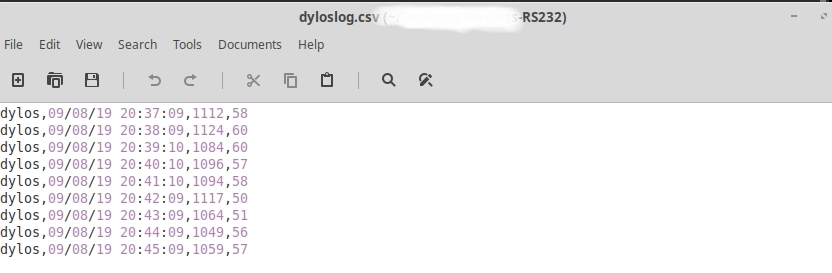 Example logfile captured from the DYLOS serial stream.
Step 3: Replace the cable host with ESP8266
After the serial protocol is understood, the next step is to attach the RS232-translated TTL signal to an ESP8266 so the particle counter can publish data wirelessly.
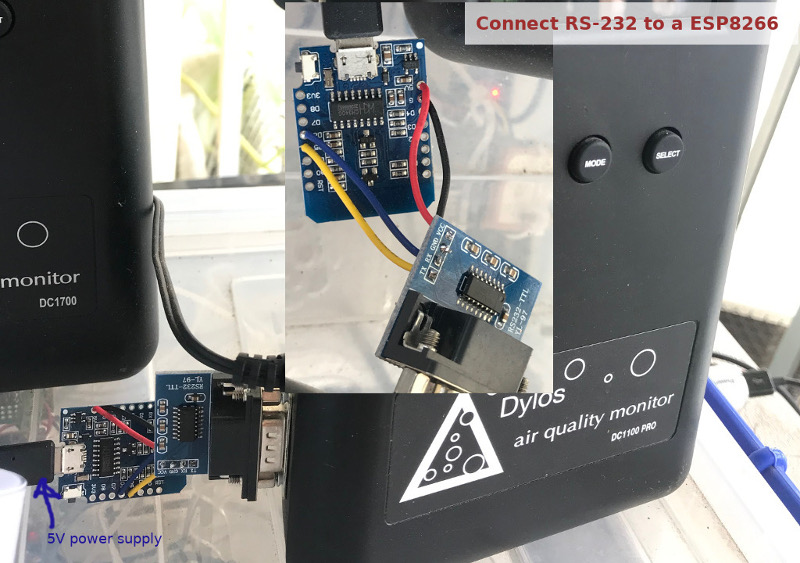 ESP8266 + RS232-TTL stage used in the archived build.
This is the key architecture change:
- DYLOS still speaks serial
- the ESP8266 becomes the always-on bridge
- downstream logging and display can happen elsewhere
Step 4: MQTT pipeline
The archived guide then pushes the DYLOS counts to an MQTT broker, making the data easy to fan out to:
- monitoring tools
- Python collectors
- lightweight web apps
- long-term storage processes
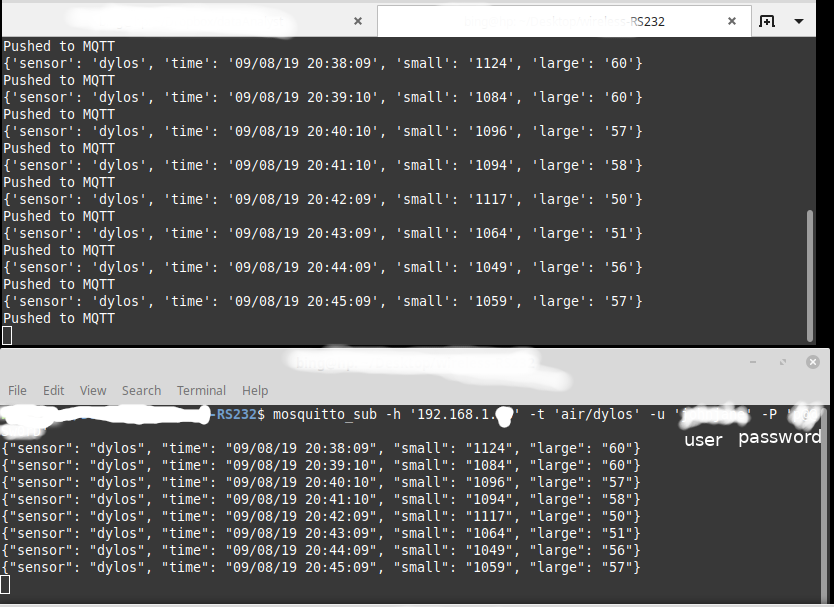 MQTT becomes the transport layer between sensor bridge and storage/display.
Step 5: SQLite + Flask display
The final stage is a small server-side app that listens to MQTT, saves the counts into SQLite, and then exposes the data through Flask for quick inspection.
The archived guide links to:
It also includes an example CREATE TABLE flow and then a simplified long-running listener for subsequent runs.
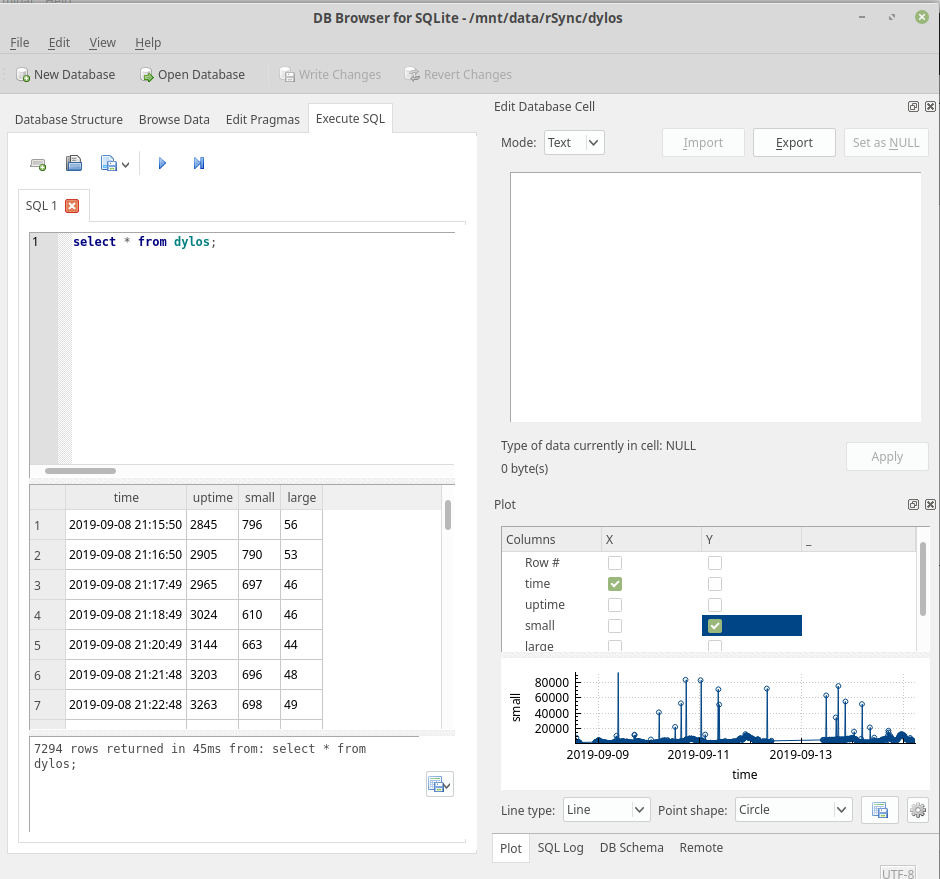 Captured particle counts stored into SQLite for later plotting and display.
Why this pattern is useful
This tutorial is more about architecture than about one cable:
- RS232 hardware can be kept at the edge
- ESP8266 acts as a cheap wireless bridge
- MQTT decouples capture from analysis
- SQLite/Flask is enough for a lightweight personal dashboard
That pattern still holds for many legacy instruments today.
Related references
Original Reference
First published on Instructables: