AQI Calculation Guide: From PM2.5 Concentration to Air Quality Index
 Courtesy of airnow.gov
This guide explains how PM2.5 concentration becomes an AQI number. It compares the US EPA breakpoint method, Vietnam’s updated (2019) calculation, and why the same AQI number means different PM2.5 levels in different countries.
What is AQI?
AQI (Air Quality Index) is a single number representing outdoor air quality derived from six pollutants: PM10, PM2.5, NO2, CO, SO2, and O3. The reported AQI is the maximum of the individual index values calculated for each pollutant.
Key concepts:
- Each country defines its own permissible concentrations — stricter standards yield higher AQI for the same air
- Two calculation approaches exist: breakpoint interpolation (US EPA, Vietnam post-2019) and linear ratio (Australia, Vietnam pre-2019)
- Different averaging periods produce different numbers from the same raw data — instant, hourly, daily, and NowCast concentrations are all distinct
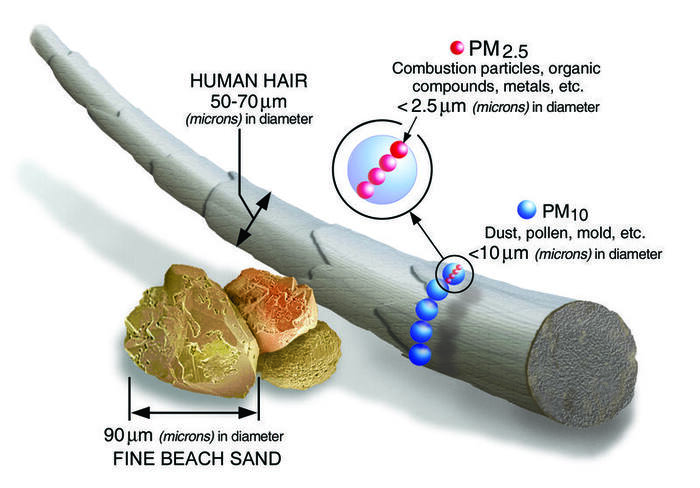 PM2.5 particles are small enough to penetrate deep into the lungs. Courtesy of EPA.
PM2.5 Standards by Country
| WHO | US EPA | China | Australia | Vietnam | |
|---|---|---|---|---|---|
| 24-hour mean (ug/m3) | 25 | 35 | 75 | 25 | 50 |
| Annual mean (ug/m3) | 10 | 12 | 35 | 8 | 25 |
Australia adopted the strictest annual standard (8 ug/m3). Vietnam’s standard is moderate relative to its economic status — stricter than China’s.
Concentration Types
Before calculating AQI, you need the right concentration value:
| Type | Definition | Use |
|---|---|---|
| Instant | Single sensor reading (per second to minute) | Raw data only |
| Hourly | Average of all readings in one hour | Real-time display |
| Daily | Average of all readings in one calendar day | Comparison to 24-hour standards |
| NowCast | Weighted average of last 12 hours | Real-time AQI forecasting |
NowCast Formula
NowCast gives more weight to recent hours, making it responsive without being noisy:
PM2.5_nowcast = sum(w^(i-1) * c_i) / sum(w^(i-1)) for i = 1 to 12
Where:
- c_i = hourly concentration (i=1 is most recent)
- w = max(c_min/c_max, 0.5)
The weighting factor w ensures recent hours dominate. At least 2 of the 3 most recent hours must be valid.
Calculation Methods
Method 1: Breakpoint Interpolation (US EPA)
AQI_p = ((I_Hi - I_Lo) / (BP_Hi - BP_Lo)) * (C_p - BP_Lo) + I_Lo
Where:
- C_p = pollutant concentration
- BP_Hi, BP_Lo = concentration breakpoints bounding C_p
- I_Hi, I_Lo = AQI index values corresponding to those breakpoints
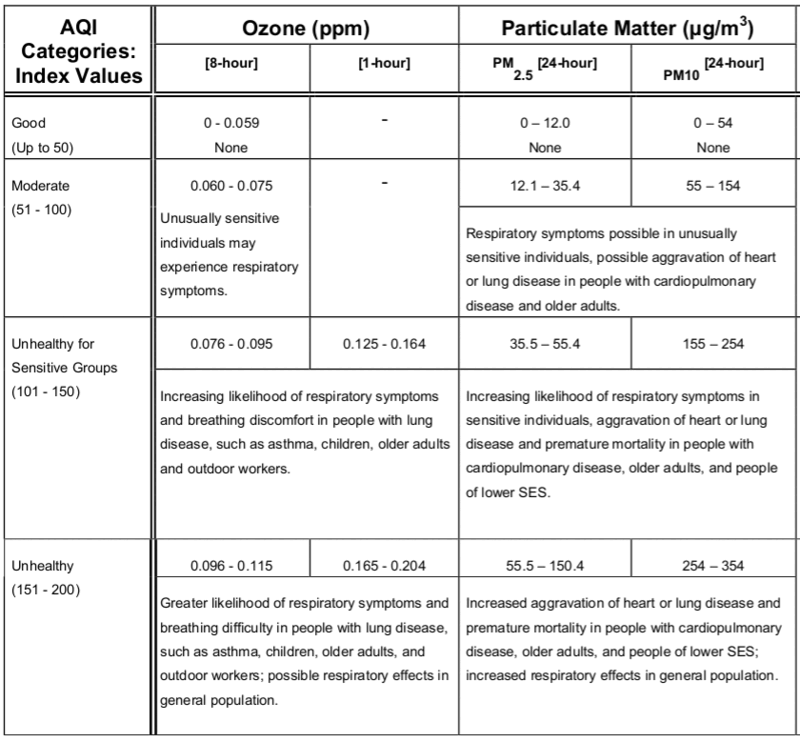 US EPA breakpoints for PM2.5 (24-hour and annual).
Example: PM2.5 = 30 ug/m3 (24-hour mean)
Look up: falls in the 12.1-35.4 bracket (AQI 51-100)
AQI = ((100-51) / (35.4-12.1)) * (30-12.1) + 51 = 88
Method 2: Linear Ratio (Australia, Vietnam pre-2019)
AQI_p = (C_p / C_standard) * 100
Where C_standard is the permissible concentration for that pollutant.
This is simpler: AQI 50 means the concentration is half the standard. But it produces a purely linear scale with no breakpoints.
Example: PM2.5 = 25 ug/m3 in Vietnam (C_standard = 50)
AQI = (25/50) * 100 = 50
Same concentration in Australia (C_standard = 25): AQI = (25/25) * 100 = 100
Vietnam’s 2019 Update
In November 2019 (Decision 1459/QD-TCMT), Vietnam switched from Method 2 to Method 1 — adopting breakpoint interpolation similar to the US EPA approach. This makes the calculation identical in structure, though the breakpoints differ due to different permissible concentrations.
Comparing US and Vietnam AQI
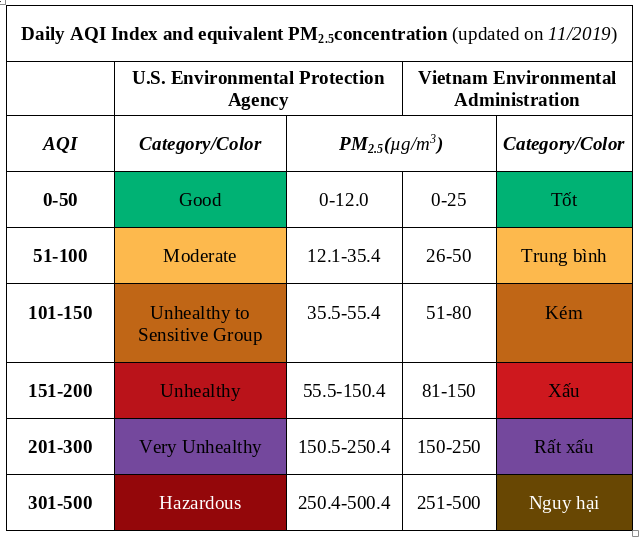 Same AQI category, different PM2.5 thresholds: “Good” in Vietnam allows higher PM2.5 than “Good” in the US.
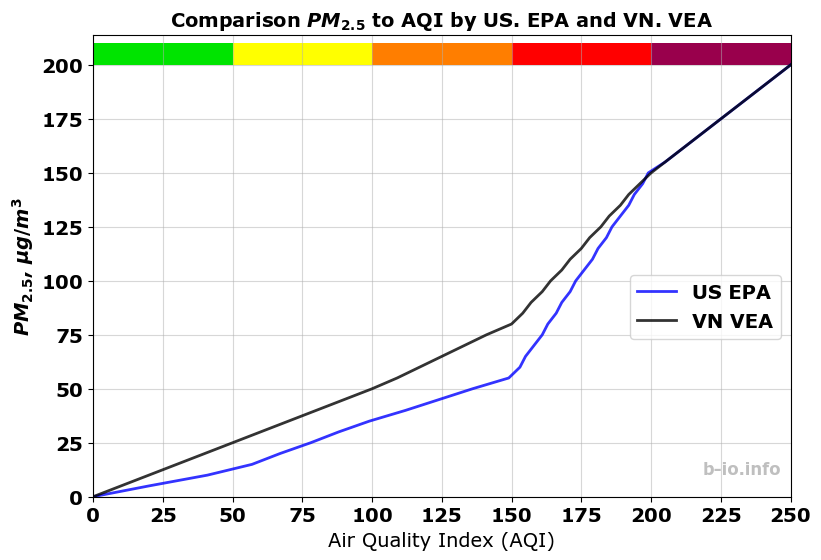
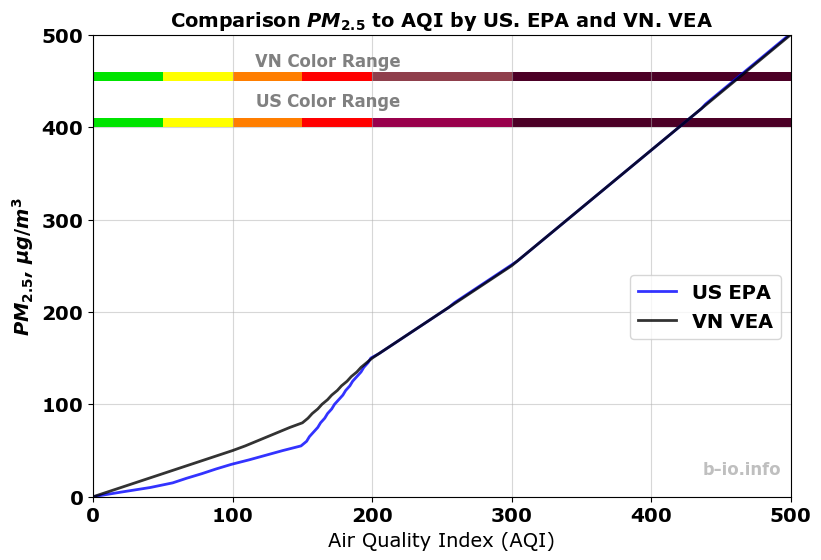 Converting PM2.5 concentration to AQI by both standards. The US EPA curve is steeper at lower concentrations — stricter for “Good” and “Moderate” categories.
Key differences:
- For Good/Moderate categories, the same AQI number corresponds to lower PM2.5 under US EPA (stricter)
- For Unhealthy/Hazardous categories, Vietnam’s standard triggers at lower PM2.5 (stricter at the high end)
- After the 2019 update, the structural calculation is identical — only the breakpoint values differ
AQI Health Scale
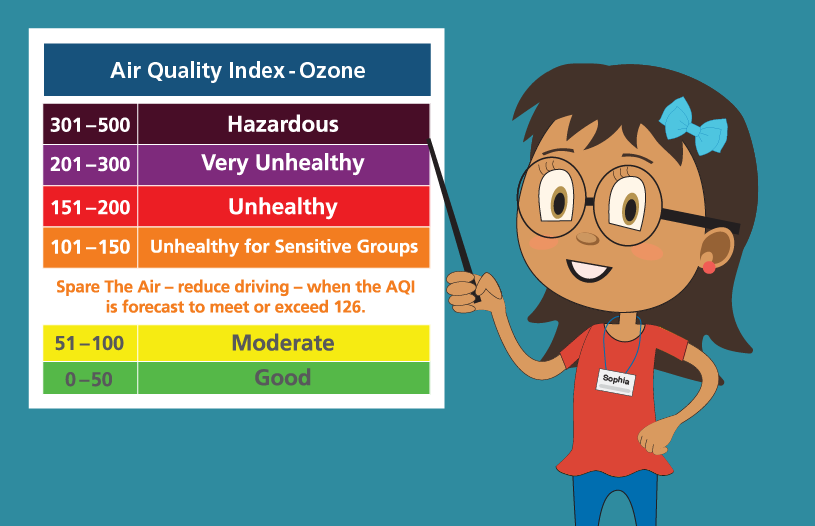 Standard AQI color bands used by most reporting systems.
Takeaways
- AQI is country-specific — the same air can have different AQI values depending on which standard is applied
- Two calculation methods: breakpoint interpolation (flexible, non-linear) and linear ratio (simple)
- Vietnam adopted the US EPA breakpoint method in November 2019
- For lower AQI categories (Good, Moderate), the US standard is stricter
- When comparing AQI numbers, always check which standard was used
References
- Decision 1459/QD-TCMT (Nov 12, 2019) — Vietnam AQI calculation guidance
- MONRE Handbook for AQI Calculation (2015)
- US EPA Technical Assistance Document for AQI Reporting (2018)
- WHO Ambient Air Quality Guidelines
- QCVN 05:2013/BTNMT — Vietnam National Technical Regulation on Ambient Air Quality
- Evaluation of the Chinese New Air Quality Index (GB3095-2012), Fanyu Gao
Originally published on b-io.info, updated January 2020.