Firewood Stove Emissions: PM2.5 in a Rural Vietnamese Kitchen
A 3-day field campaign measured particulate matter near an active firewood cook stove in a rural home. PM concentration during cooking was 65-95% higher than daily background.
Abstract
A 3-day experiment evaluated particulate matter emissions from a firewood cook stove in a rural home in Vietnam. The site had no large industrial combustion within 2 km and a provincial road approximately 500 m away screened by dense trees. One Plantower PMS7003 measured PM2.5 and PM10 at 1-minute intervals. Cooking emissions were compared against:
- Immediate Background Concentration (IBC): average PM in the 2 hours before and after cooking
- Average Background Concentration (ABC): daily average PM excluding cooking periods
Results: PM during cooking was 6-125% higher than IBC and 65-95% higher than ABC. Background PM2.5 varied dramatically (38-58 ug/m3 daily average), challenging the assumption that rural air is uniformly clean.
Method
Equipment
- Plantower PMS7003 (PM2.5 and PM10)
- Bosch BME280 (temperature and relative humidity)
- Raspberry Pi with Python scripts, 1-minute sampling
- 4S lithium battery for mobility
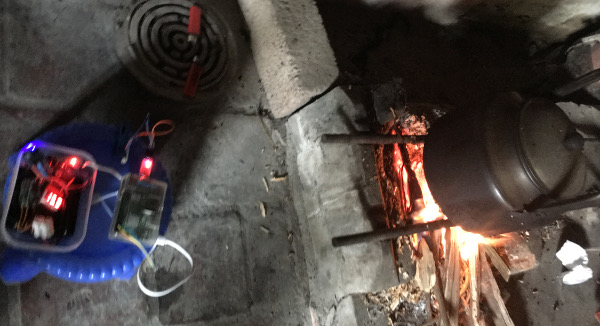 Fig. 1: Sensor kit placed ~50 cm from the firewood stove at the same height as the stove base.
Locations
Primary site: Residential home in an agricultural village. No industrial combustion within 2 km. Provincial road ~500 m to the north with dense trees in between. Light-to-moderate traffic (mostly motorbikes, cars, light trucks). No distinguishable advective airflow during sampling.
Secondary site: Hong Linh town (Ha Tinh province), ~100 m from the national highway (A1).
Stove Description
Simple construction: two steel bars bridging a concrete base. No active fan. Fuel was small trees and bushes gathered locally. The stove was semi-open (two sides adjacent to walls, other sides open to the garden). Used only for boiling water during this campaign — no frying or oil-based cooking.
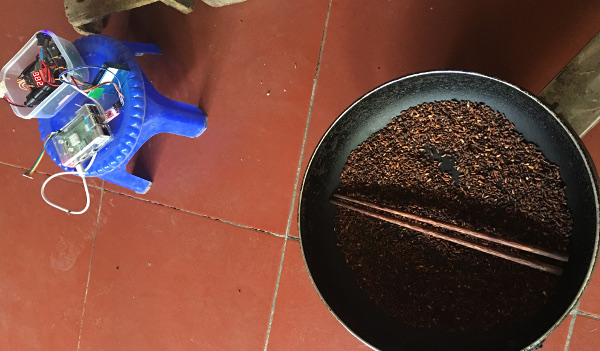 Fig. 2: One-time comparison measurement near a gas (LPG) stove.
Analysis
Data cleaned by filtering single-peak anomalies >500 ug/m3. Graphs produced with Matplotlib and Seaborn. Cooking-period emissions compared to IBC and ABC.
Results
3-Day PM Concentration Timeline
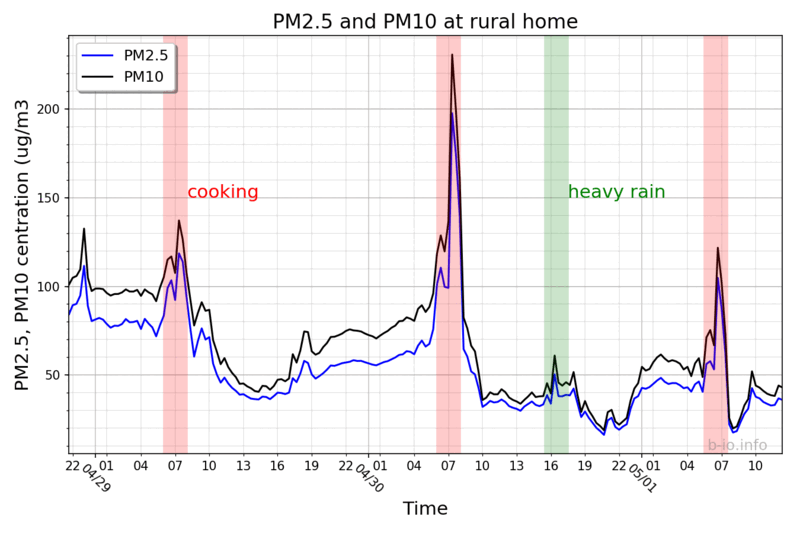 Fig. 3: PM2.5 and PM10 over 3 days (20-min resolution). Cooking periods and heavy rain marked.
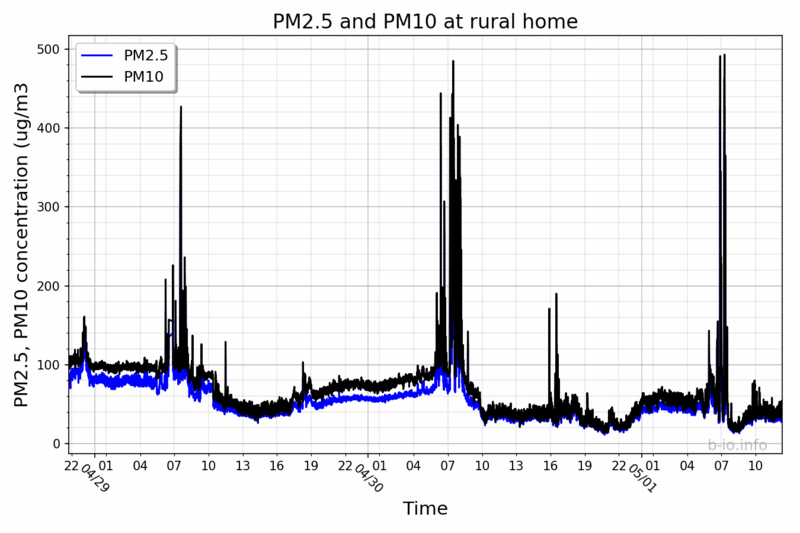 Fig. 4: Same data at 1-minute resolution showing peak detail during cooking.
Cooking vs Background
| Metric | Day 1 (PM2.5 / PM10) | Day 2 (PM2.5 / PM10) | Day 3 (PM2.5 / PM10) |
|---|---|---|---|
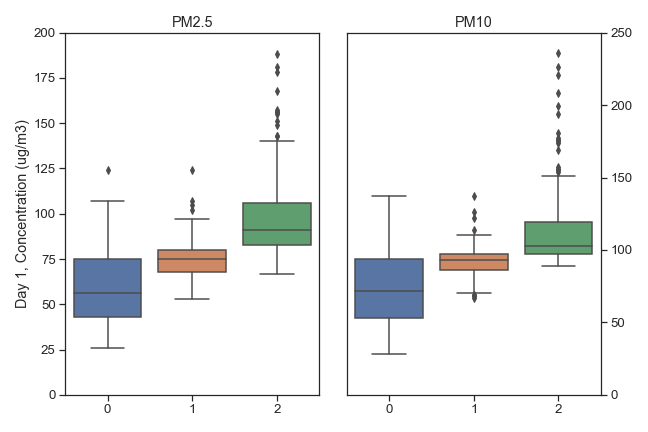
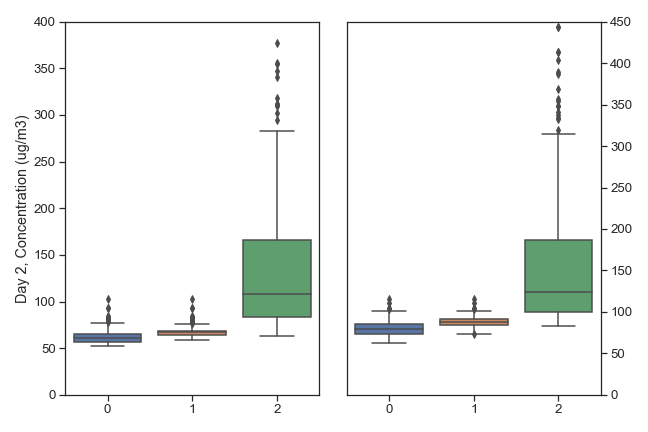
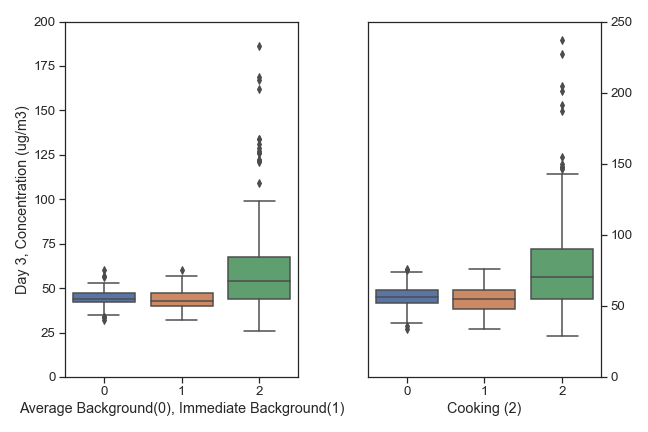
| Cooking (ug/m3) | 102 / 118 | 72 / 84 | 74 / 90 |
| Cooking / IBC | 1.38 / 1.28 | 1.16 / 1.06 | 2.24 / 2.25 |
| Cooking / ABC | 1.76 / 1.64 | 1.71 / 1.65 | 1.95 / 1.91 |
Cooking consistently produced 65-95% more PM than the daily average background. The ratio to immediate background was wider (6% to 125%) because IBC is sensitive to conditions just before/after cooking.
 |  |  |
|---|---|---|
| Day 1 | Day 2 | Day 3 |
Fig. 5: Box plots of PM by period (IBC, ABC, Cooking) for each day. Outliers during cooking correspond to stoking/blowing events.
Background Variability
The background PM2.5 varied from ~80 ug/m3 on day 1 to 10-40 ug/m3 on day 3. This challenges the assumption that rural background PM is stable.
Temperature and Humidity
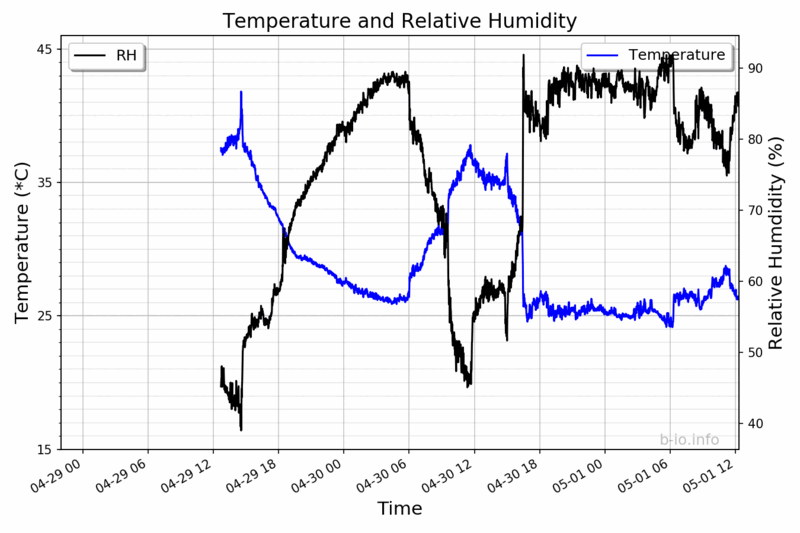 Fig. 6: Temperature dropped 8C and RH rose 15% during the heavy rain event on April 30.
Secondary Location (Hong Linh)
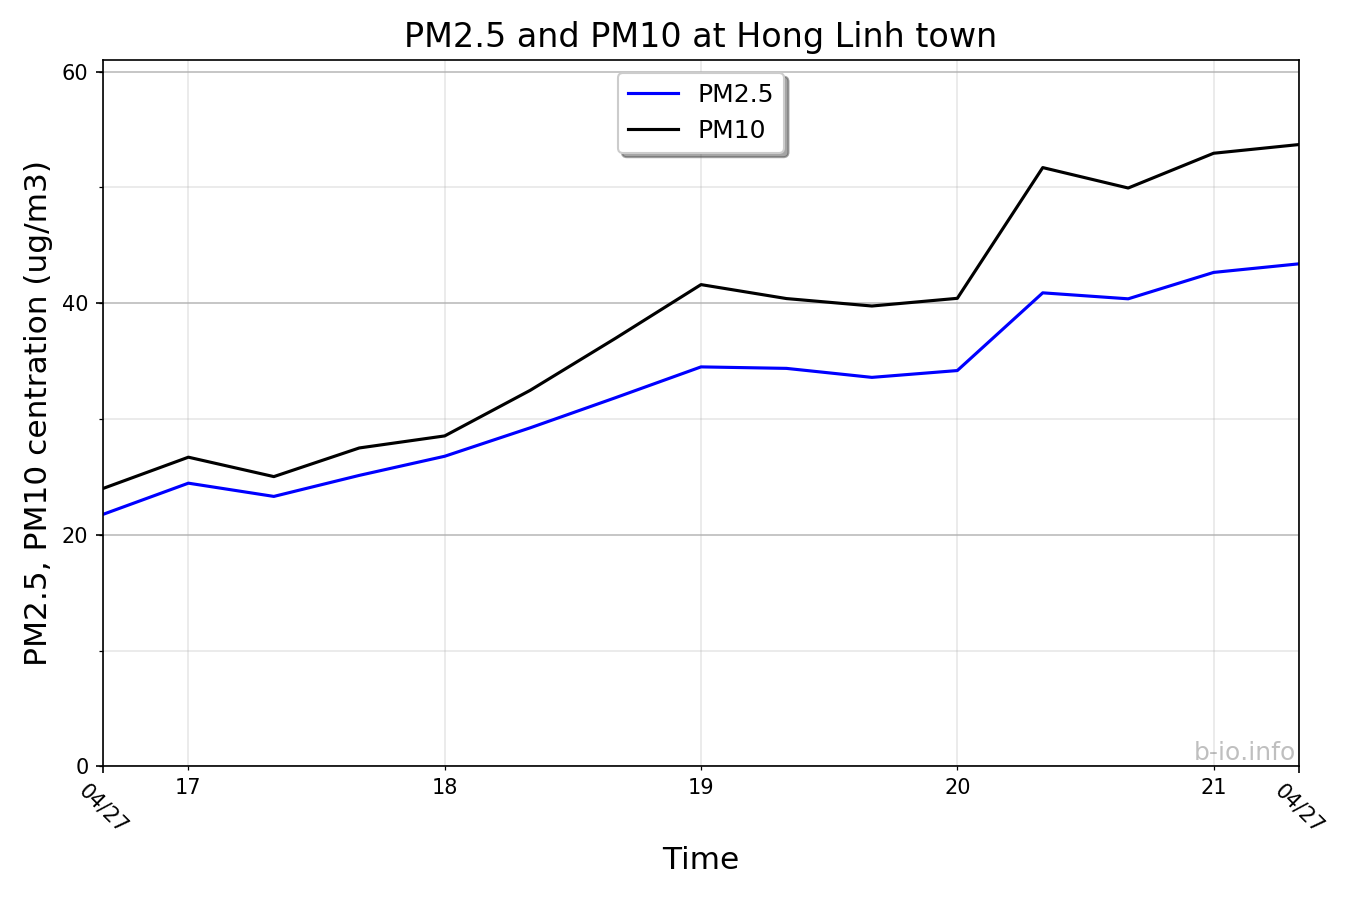 Fig. 7: PM2.5 and PM10 near the national highway. PM2.5/PM10 ratio = 0.86, consistent with combustion-dominated sources.
PM2.5 comprised 83-86% of PM10 at both rural and town sites, consistent with EPA reports that combustion and secondary atmospheric pathways dominate the fine particle fraction.
Discussion
- Sampling height (stove-base level) likely underestimates actual human exposure — cooks lean over the stove where concentration is higher
- Wood stoves are commonly used for more than boiling water; frying and oil-based cooking would increase PM further
- The PMS7003 overestimates PM2.5 by approximately 2x compared to BAM reference monitors — absolute concentrations should be interpreted cautiously, but relative ratios (cooking vs background) remain valid
- Literature reports PM2.5 from solid fuels at 154-6901 ug/m3 (various studies). Pokhrel et al. (2015) found biomass stoves emitted 656 ug/m3 vs 80 ug/m3 for electric cooking
- Hu et al. (2014) found that vented stoves reduce PM2.5 by 35-55% — ventilation is the most accessible mitigation
Conclusions
- Firewood cooking produces 65-95% more PM than daily background in a rural Vietnamese setting
- Rural background PM2.5 is not stable — it varied 2-3x over 3 days, likely driven by weather and regional transport
- PM2.5 dominates PM10 (83-86%) at both rural and roadside sites
- Ventilation is the primary mitigation — even without switching fuels, a vented stove design significantly reduces exposure
- The PMS7003 sensor is suitable for relative comparisons but not absolute health-standard assessment
Acknowledgements
Thanks to Dr. Han Huy-Dung for lending the PMS7003 sensors.
Originally published on b-io.info, 2019. 3-day field campaign in rural Ha Tinh province, Vietnam.