Indoor vs Outdoor PM2.5: How Well Does a Sealed Apartment Protect You?
A 5-day experiment during a holiday vacation measured PM2.5 and PM10 inside and outside a sealed 10th-floor apartment in Hanoi. Closing windows and doors reduced PM by only 13-17%.
Abstract
This study evaluated the particle isolation of a modern high-rise apartment when all windows and the entrance door were closed. Two Plantower PMS7003 sensors monitored PM2.5 and PM10 inside and outside for 170 continuous hours during a 5-day vacation (no residents present). The indoor-to-outdoor (I/O) ratios were 83-86%, meaning closed windows provided only a 14-17% reduction in particulate matter. A distinct diurnal pattern appeared: I/O ratios were higher in the afternoon and lower in the early morning, correlating with outdoor temperature.
Background
Residents in modernizing cities like Hanoi have been moving to newer high-rise buildings with sliding glass windows that provide better sound and thermal isolation. A natural question is whether these buildings also protect against PM2.5.
The author hypothesized that a closed, well-constructed apartment would substantially reduce indoor PM exposure. The data did not support this hypothesis.
Method
- Location: 10th floor of a 20+ floor building in southern Hanoi (Vinaconex construction, <3 years old), facing a quiet corner with relatively low ground-level traffic
- Sensors: Two Plantower PMS7003, each in a sealed box with a constant-rate fan
- One placed indoors, 70 cm above floor level
- One placed on the balcony at the same height
- Duration: 170 hours continuous, 1-minute sampling interval
- Conditions: All windows shut, entrance door closed, no residents present
- Analysis: Python/Jupyter with Matplotlib; data aggregated to 10-min and 1-hour intervals
Results
PM2.5 Concentration: Indoor vs Outdoor
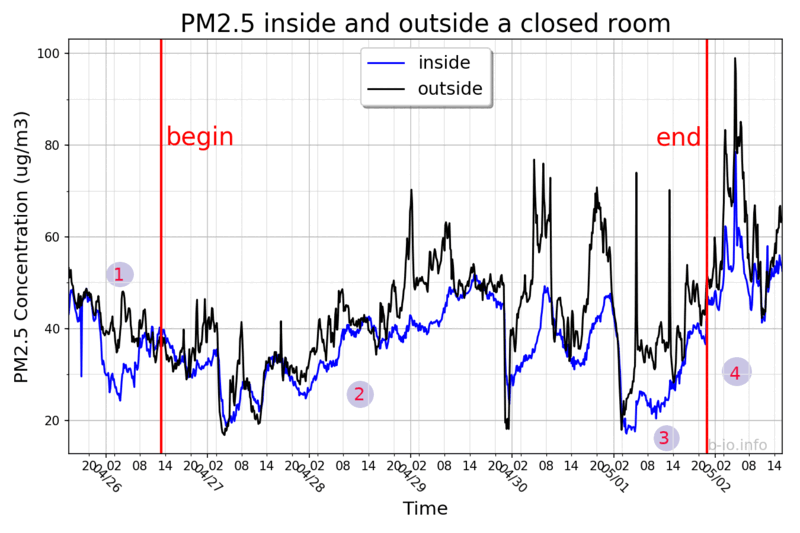 Fig. 1: PM2.5 concentration (10-min interval). Red vertical lines mark when the apartment was sealed and reopened.
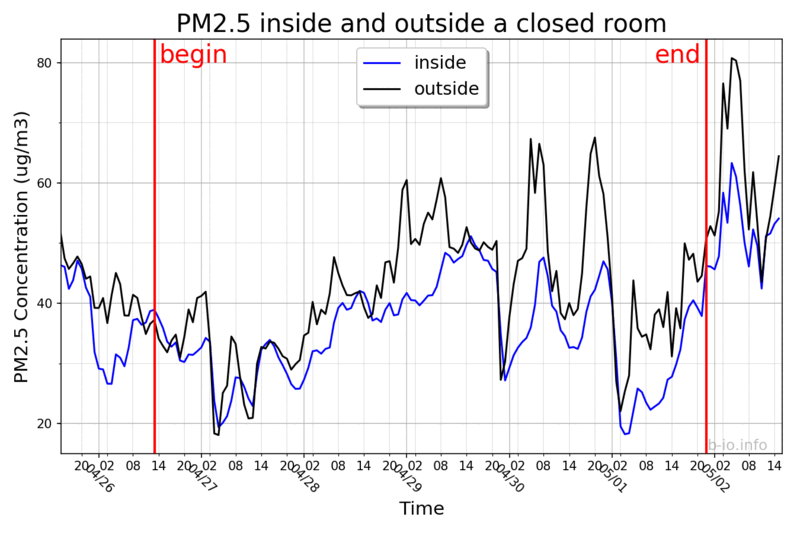 Fig. 2: Same data aggregated to 1-hour intervals.
PM10 Concentration
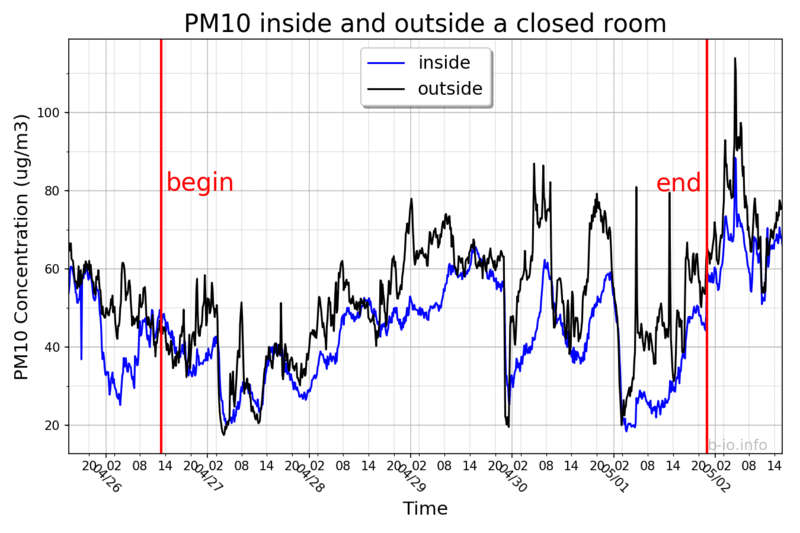 Fig. 3: PM10 concentration (10-min interval).
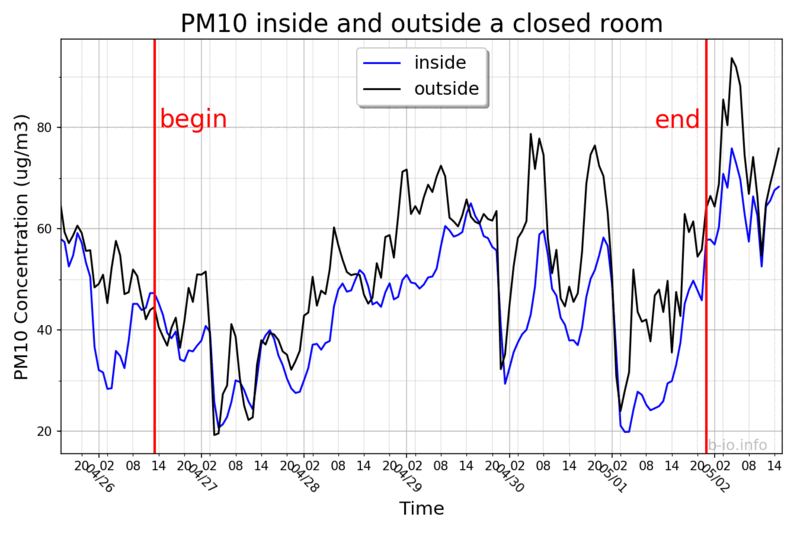 Fig. 4: PM10 concentration (1-hour interval).
I/O Ratios
| Metric | Entire period (170h) | Isolated period (129h) |
|---|---|---|
| Inside PM2.5/PM10 | 85% +/- 5% | 86% +/- 5% |
| Outside PM2.5/PM10 | 82% +/- 4% | 83% +/- 4% |
| PM2.5 In/Out | 87% +/- 14% | 86% +/- 14% |
| PM10 In/Out | 85% +/- 15% | 84% +/- 16% |
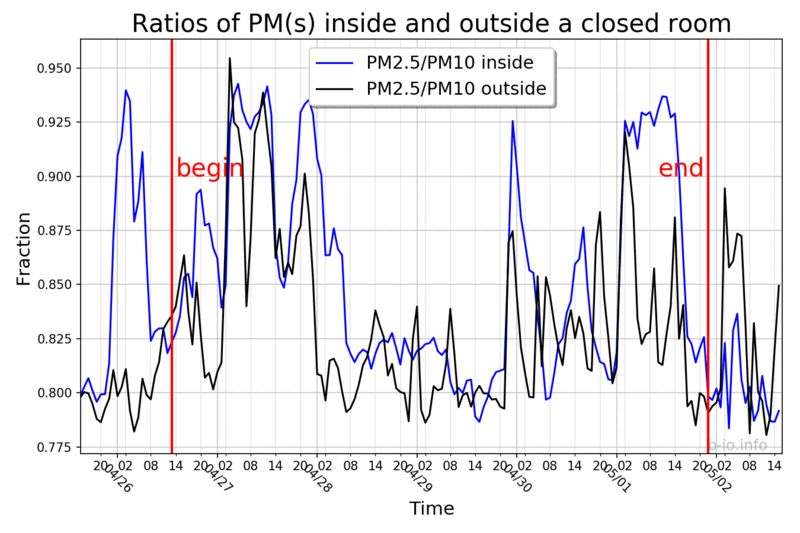 Fig. 5: Ratios of PM2.5/PM10 for indoor and outdoor environments.
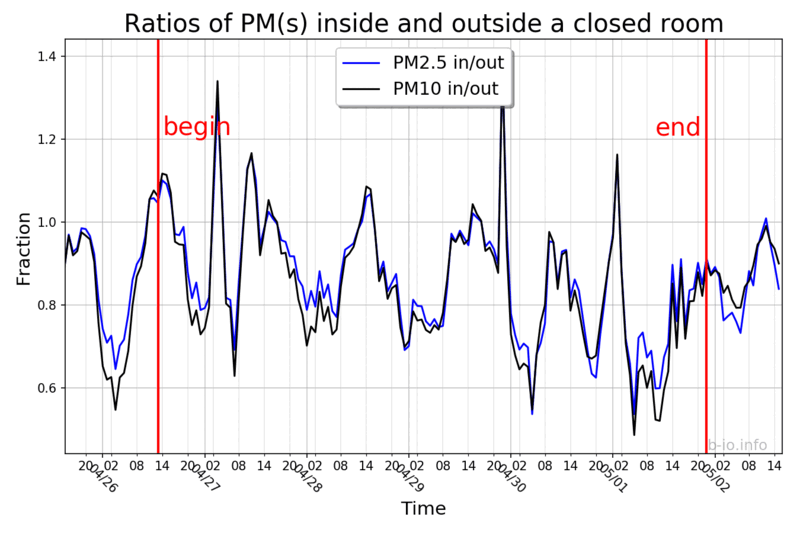 Fig. 6: Indoor/outdoor ratios showing clear diurnal pattern — higher in afternoons, lower in early mornings.
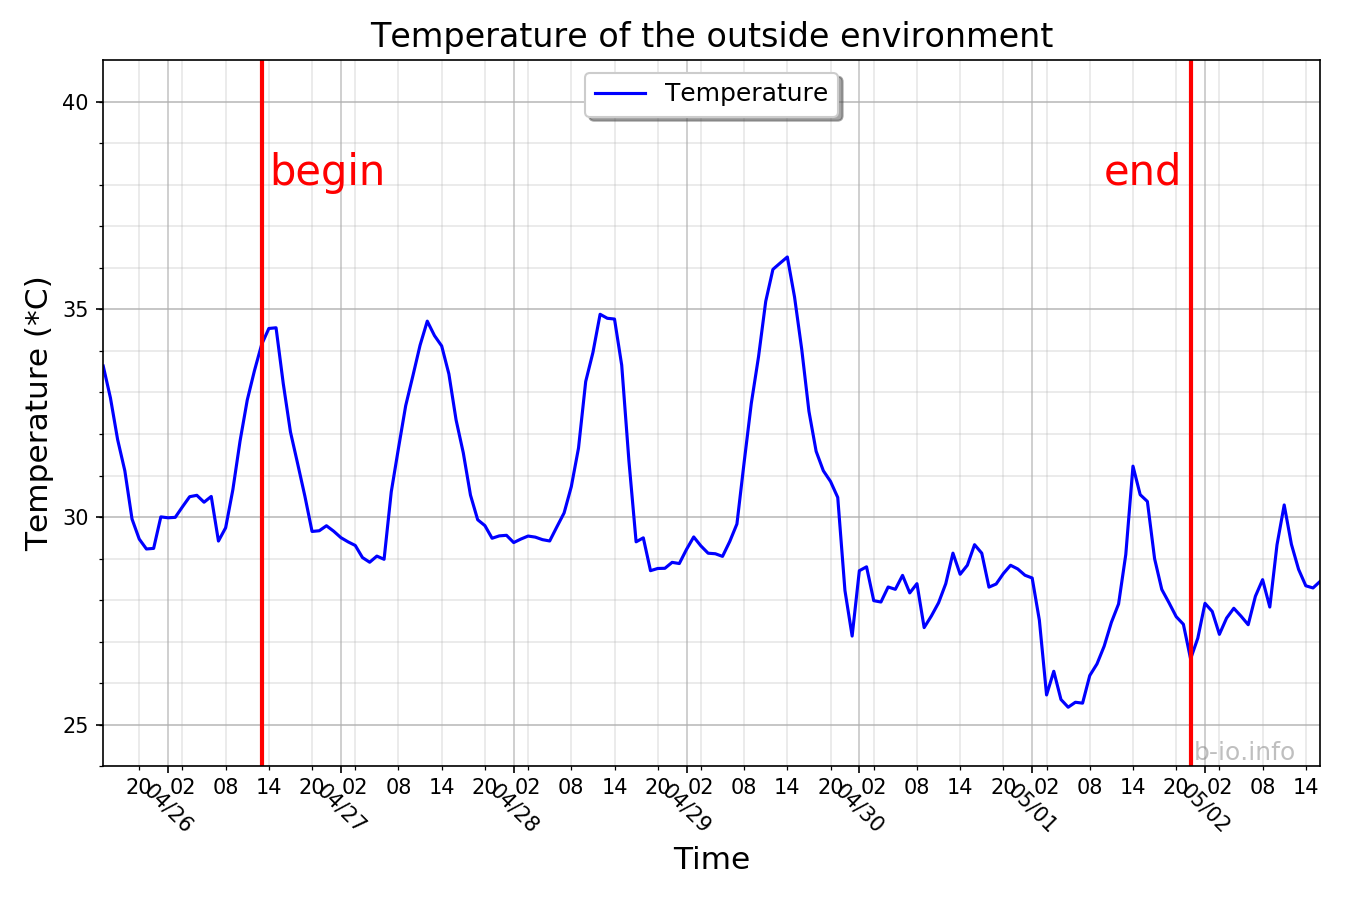 Fig. 7: Outdoor temperature correlating with the I/O ratio pattern.
Key Episodes
- E2 (typical pattern): Indoor PM2.5 followed outdoor changes with a delay and smaller magnitude. When outdoor concentration dropped, indoor levels remained slightly higher.
- E3 (heavy rain, April 30): 30-60 mm rainfall caused a sharp outdoor PM drop. Indoor concentration responded with only one-third the reduction.
- E4 (windows reopened): The indoor-outdoor difference disappeared almost instantly once windows were opened.
Comparison with Literature
These results are consistent with other studies:
- Challoner & Gill (2000): I/O ratios close to or above 1 in 10 buildings in Ireland
- Massey et al. (2008): I/O ratios of 0.76-1.46 in residential homes in central India
- Another study found lower I/O ratios (0.5-0.8) with daytime peaks
Conclusions
- Sealed windows reduce PM by only 13-17% — far less than the author expected
- PM2.5 dominates PM10 both indoors and outdoors (82-86% of PM10 is PM2.5)
- Diurnal pattern: I/O ratios are lowest in early mornings and highest in late afternoons, correlating with temperature
- The delayed indoor response suggests transport is slower than advection but faster than pure diffusion
- For better protection, residents would need sealed fixed windows plus positive-pressure filtered air supply
Acknowledgements
Thanks to Dr. Han Huy-Dung from SPARC Lab (HUST) for lending PMS7003 sensors.
Originally published on b-io.info, 2019. 170 hours of continuous monitoring during April-May 2019.